CELLULAR IMAGING TECHNIQUES
SHG/THG
Second Harmonic (SHG) and Third Harmonic Generation (THG) Imaging
We can image SHG using the Zeiss 780 and Zeiss 510 multiphoton microscopy systems. The THG & SHG can be imaged using the Zeiss 780 multiphoton system.Third Harmonic Generation (THG) and second harmonic generation (SHG) microscopy is a non-fluorescent multi-photon technique that combines the advantages of label-free imaging.
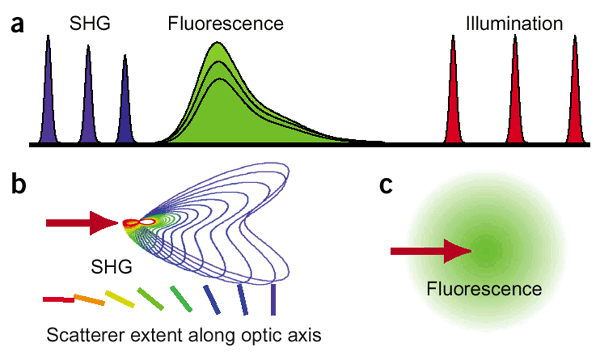
SHG is based on a nonlinear optical effect known as second harmonics generation (SHG). SHG/THG has been established as a viable microscopy imaging contrast mechanism for visualization of cell and tissue structure and function. A SHG microscope obtains contrasts from variations in a specimen’s ability to generate SHG light (say 450 nm) from the incident light (say 900 nm) while a conventional optical microscope obtains its contrast by detecting variations in optical density and path length of the specimen. SHG requires intense laser light passing through a material with a noncentrosymmetric molecular structure. Though SHG requires a material to have specific molecular orientation in order for the incident light to be frequency doubled, some biological materials can be highly polarized, and assembled into fairly ordered, large noncentrosymmetric structures. Biological materials such as collagen, microtubules, and muscle myosin can produce SHG signals. The SHG signal is propagated mostly in the forward direction but backward direction signals are also recorded for some of the specimens.
Image
James Gilmore (Foreign Affairs '71, Law '77), Governor of Virginia, 1998-2002
SHG is directional depending on the distribution and orientation of the nonlinear dipoles (b) whereas in general, fluorescence is isotropically emitted (c).
THG is a process in which the energy of three incoming photons (1200 nm) is combined to generate one out going photon (400 nm) with a wavelength of exactly one third of the excitation beam. All the photon's energy is converted. None is deposited in the specimen, as during a fluorescence excitation and emission cycle. THG signals were sufficiently strong for informative imaging of blood vessel walls and blood cells, muscle fiber sarcomeres, nerve fibers and nuclei of some cell types.
What is the difference between THG and SHG microscopy? In SHG, the energy of two photons is combined to create one with half the wavelength of the excitation beam. THG, on the other hand, is induced by several mechanisms. One is an interface in the specimen, such as a refractive index mismatch. As a result, structures are highlighted that also would come up in phase contrast or interference contrast microscopy. THG, however, is induced only at the focal point of the excitation laser, enabling 3D-imaging of tissues. Another THG mechanism is resonance enhancement. When a chromatic material absorbs the wavelength of the produced THG signal, contrary to intuition, this causes an increase in signal intensity by resonance processes.
NAD(P)H/NADH/FAD/TRP Imaging
Biomarkers (NAD(P)H, NADH, FAD, Tryptophan) for Cellular Metabolism
The importance of autofluorescence for studying cells and tissues lies mainly in its potential for diagnostic applications and as a research tool for understanding the underlying mechanisms of molecular interactions and cellular processes under native conditions. We developed a methodology to investigate the energy metabolism using intrinsically fluorescent NADH and flavins as biomarkers for cellular energy metabolism. We also developed a methodology using 2-photon and lifetime imaging methodology to discriminate the NAD(P)H and NADH. We also developed a 3-photon lifetime imaging configuration to investigate tryptophan as an alternative biomarker for energy metabolism.
Image

Image

Image

Intravital Imaging
Expand content
Intravital/In vivo Imaging Microscopy
The Zeiss 780 multiphoton system equipped with intravital imaging option (Objective converter). The existing microscope is an inverted epi-fluorescent microscope and we have included an objective inverter for intravital imaging. The imaging can be implemented with young mice as shown in figure 2 or creating a window on the skull. We are also equipped with Zeiss dipping lenses (10x, 20x & 40x) for intravital imaging. We are also developing a dedicated intravital imaging lens and fiber-optic based system.
Image

FLIM Imaging
Fluorescence Lifetime Imaging Microscopy (FLIM)
The fluorescence lifetime refers to the average time the molecule stays in its excited state before emitting a photon, which is an intrinsic property of a fluorophore. Fluorescence lifetime is sensitive to the local environment including pH, refractive index, temperature and insensitive to change in concentration and laser excitation intensity. There are different ways for measuring the fluorescence lifetime of a fluorophore: frequency domain (FD) and time domain (TD). Fluorescence lifetime measurements are performed both in single photon excitation and multiphoton excitation. Multiphoton microscopy provides several advantages in autofluorescence imaging over single photon confocal microcopy, such as less photobleaching, photodamage, scattering for live cell and tissue imaging. We have both one and two-three-photon lifetime imaging systems.
a. TD FLIM: The most common implementation of time domain (TD) fluorescence lifetime measurements are based on wide-field (gated camera), laser scanning microscopes both confocal and multi-photon mode with high speed detectors and electronics. Two- and Three-photon excitation lifetime imaging options are integrated with our existing Zeiss 780 multiphoton microscopy system. This is called time-correlated single photon counting (TCSPC) and the imaging board (SPC-150) and the FLIM hybrid detector (HPM-100-40) are from Becker & Hickl, Germany. We have two-channel FLIM detectors coupled to the Zeiss 780 NDD port. Both detectors allow simultaneous imaging of two fluorophores such as used for FRET or endogenous molecules such as tryptophan and NADH. Since the system optics transmits 300-1000 we are able to image auto-fluorescent tryptophan (300-400) with three-photon excitation (740nm).
b. Gated Camera: Ultrafast-gating image intensifier coupled to a CCD camera is used to acquire time-resolved images of proteins in living cells. This camera allows operating a gate width from 300 ps to 1 ms and a repetition rate from single shots to 110 MHz (PicoStar, Lavision, Germany). This gated image intensifier camera is synchronized with high-speed excitation laser pulses to trigger the camera gating pulse via a time-delay unit and synchronizing electronics. This gated camera can be coupled to any epi-fluorescence or TIRF microscopy system to implement FLIM or FLIM-FRET imaging. A rapid lifetime determination (RLD) method is used for the gating camera-based FLIM imaging. We developed data analysis software for single and double exponential decays.
c. FD FLIM: the fluorophores are excited with periodically intensity-modulated light to determine the modulation in the emission signal. The fluorescence emits at the same modulation frequency but phase shifts due to the delay caused by the lifetime of the fluorophore relative to the excitation time. This delay is measured as a phase shift (ϕ), and the modulation frequency (ω) in radian/sec. The lifetime of the fluorophore also causes demodulation to the modulated excitation by a factor mω, as a function of the decay time and light modulation frequency.
The ISS Alba FD FLIM, digital frequency-domain FastFLIM confocal (2 channels) system is equipped with a Nikon TE300 inverted epi-fluorescence microscope, Fianium SC-450 supercontinuum laser ranging from 450 to 2000 nm (usage wavelength is 450-900 nm), 375 nm laser line for NADH and NAD(P)H imaging and Two avalanche photodiode
FCS/FCCS
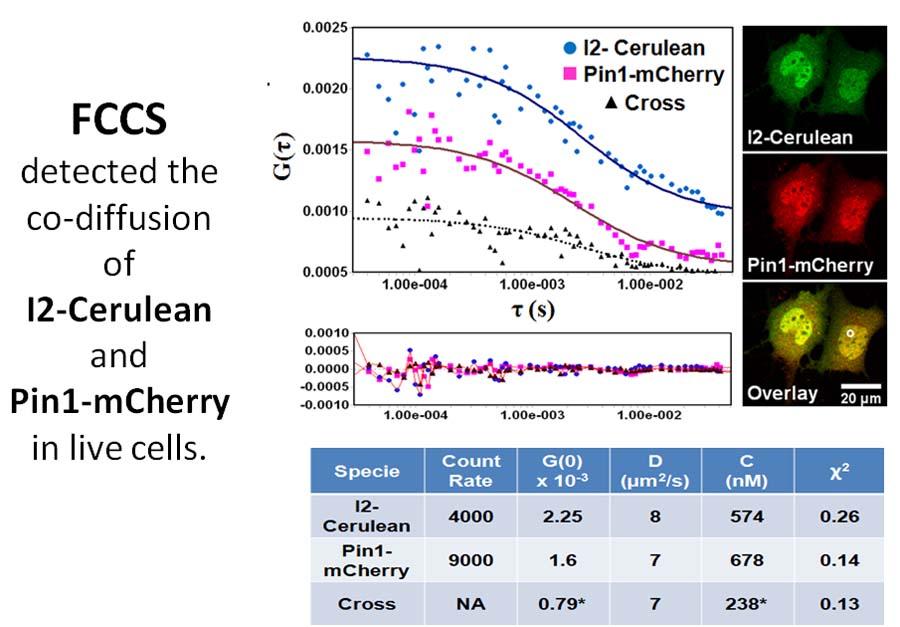
Fluorescence Correlation and Cross-Correlation Spectroscopy (FCS)
Two systems are available at the Keck Center for FCS measurements - Becker & Hickl FLIM system coupled to the Zeiss 780 with two-photon illumination; ISS Alba system with one-photon illumination.
FCS is such a sensitive analytical tool because it observes a small number of molecules (nanomolar to picomolar concentrations) in a small volume (~1μm3). Florescence correlation spectroscopy (FCS) is an experimental technique that that measures fluctuations in fluorescence intensity caused by the Brownian motion of particles or molecules. Brownian motion is the random motion of particles/molecules suspended in a fluid that results from collisions with other molecules in the fluid. The initial experimental data is presented as intensity over time but statistical analysis of fluctuations makes it possible to determine various physical and photo-physical properties of molecules and systems. When combined with analysis models, FCS can be used for quantitative measurements of diffusion coefficients, hydrodynamic radii, average concentrations, kinetic chemical reaction rates, and single-triplet state dynamics.
Image

The system configuration for FCS:
Confocal imaging system: ISS Alba V 2 channels
Two SPCM-AQR-15 APDs
Multi laser lines dichroics for FCCS or dual-color FCS
Individual pinholes control for dual-color FCS optimization
Nikon TiE and 60X / 1.2 NA water objective
Laser sources: 1p
ISS diode 375-nm laser
Fianium super-continuum laser lines at 448, 488, 514, 561, 635 nm
Data acquisition: ISS VistaVision software
Count mode, time tagged mode and time resolved time tagged mode
Time tagged mode allows resampling of the ACF calculation
Time resolved time tagged mode takes both FLIM and FCS
Support FCS acquisition at selected multi locations and in time series
Data analysis: ISS VistaVision software
Online calculation of the ACF curve by the multi tau method
Provide many built-in fitting routines for both 1p and 2p PSFs in 2D or 3D
Allow users edit fitting equations to customize or define own models
Process as many as ACF curves at the same time and allow global fittings through linking the same parameters in different ACF curves
Provide utilities to easily export data and results
Image
Screening (HCS)
High Content Screening System (multiwell plates)
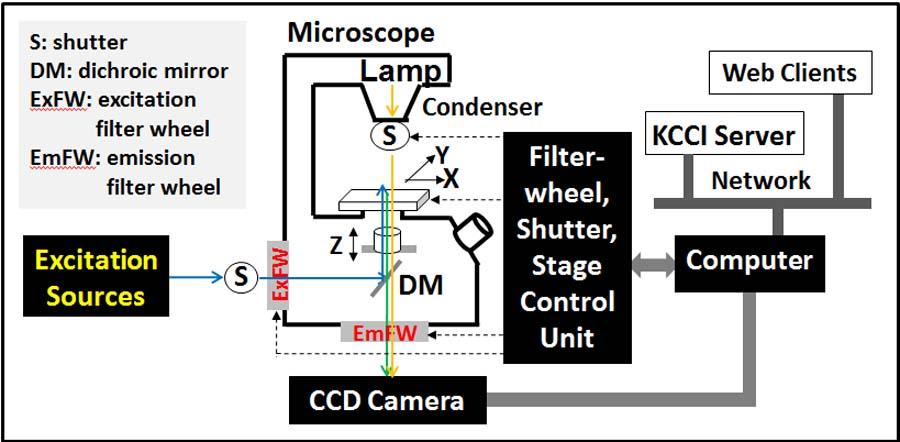
This is a custom developed system based on the existing wide-field microscopy system. Two color High-content screening of multi-well plates (Max 96 well plates). All the hardware used for the wide-field can be used for the HCS system. Currently HCS system is used to screen FRET sensors.
Image
Image
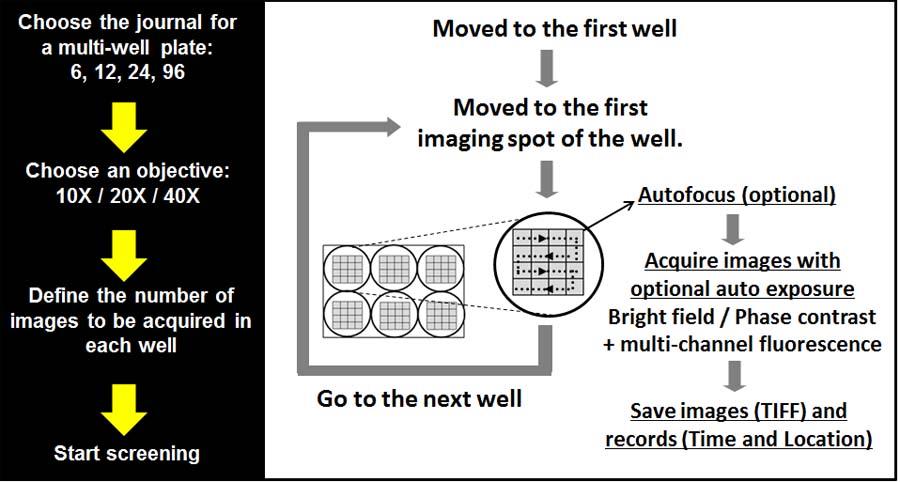
Schematic and hardware configuration of the wide-field high content screening system (96 well plates)
FRET
Förster (or fluorescence) resonance energy transfer (FRET) Microscopy
FRET is a process by which radiationless transfer of energy occurs from a fluorophore molecule in the excited state to a molecule in close proximity in the ground state. The molecule donating the energy is called 'Donor' (D) and the molecule accepting the energy is called 'Acceptor' (A). When this occurs, the donor is said to be quenched and the acceptor is sensitized and the event becomes inter alia the basis for calculating proximities between molecules, providing a non-invasive approach to visualize the spatio-temporal dynamics of the interactions between protein partners in living specimens. Suitable fluorophore FRET partners are one of the keys for a successful FRET application. FRET pairs can be selected from exogenous and endogenous fluorophores, the former being organic dyes, visible fluorescent proteins and quantum dots. An important criterion for the FRET pair selection is the Förster distance (Ro); a larger Ro will increase the likelihood of a FRET event.
This FRET approach is implemented in all above mentioned microscopy systems. If it is an intensity based system, after data acquisition the image should be corrected for spectral bleedthrough contamination using the PFRET software as explained briefly in the software section. We also have all the required filters for many available FRET pairs.