Any fluorescence microscope (inverted or upright) can be converted to use for W-FRET microscopy. There are a number of papers listed in the literature for various protein studies using W-FRET systems (Day, 1998; Day et al, 2003; Gordon et al, 1998; Jovin and Arndt-Jovin, 1989; Kam et al, 1995; Kraynov et al., 2000; Periasamy and Day, 1999; Varma and Mayor, 1998). For W-FRET, it is advisable to use a single dichroic to acquire the donor (D) and acceptor (A) images for the donor excitation wavelength in the double-labeled specimen. This can be achieved by using excitation and emission filter wheels in the microscope system. This option helps to reduce any spatial shift of the donor and acceptor channel images, since the processed FRET image is obtained through pixel-by-pixel calculation as described in the FRET data analysis section.
Even though W-FRET microscopy is the simplest and most widely used technique, there is a major limitation to W-FRET in that the emission signals originating from above and below the focal plane contribute to out-of-focus signals that reduce the contrast and seriously degrade the image. Digital deconvolution microscopy in the W-FRET system helps to localize the proteins at different optical sections, but this requires intensive computational processes to remove the out-of-focus information from the optical sectioned FRET images (Periasamy and Day, 2005 (Chapter 7); Elangovan et al., 2003). For protein interactions taking place homogeneously over a wider area of a cell (e.g. nucleus), W-FRET is an entirely suitable technique.
How to collect FRET images
The wide-field microscopy requires a high-speed and high sensitivity CCD camera (may be cMOS (Flash 4.0) or EMCCD camera). To allow simultaneous monitoring of spectral emissions at two wavelengths for a donor/acceptor FRET, a dichroic filter is used that reflects the donor excitation wavelength to excite the double-labeled cells and transmit the two emission (donor and acceptor) bands.
For example, for the Cerulean-Venus pair, three cover slips are required to correct the SBT signal from the contaminated FRET image - single labeled donor cells (D), single labeled acceptor cells (A), and double labeled cells (D+A). Cells expressing the Cerulean- or Venus-fusion protein are initially identified using the appropriate filter sets. An excitation and emission filter wheel is required to acquire the control and the contaminated FRET image. The camera gain, neutral density (ND) filter and image acquisition time are kept constant for all the seven images collected as described in the data processing section.
The background subtraction of the image is important to remove the autofluorescence, detector and optical noise. The SBT correction should be implemented as discussed in the FRET data analysis section (Elangovan et al 2003; Periasamy and Day, 2005 (Chapter 7)). In brief, (1) single labeled donor cells should be excited with donor molecule excitation wavelength and D- and A- channel images are acquired. (2) Single labeled acceptor molecule should be excited with donor and acceptor wavelength and the A- channel images are acquired. (3) Double labeled (D+A) cells should be excited with donor excitation wavelength and the D- and A- channel images are acquired. Acceptor excitation wavelength will be used to excite the D+A labeled cells and collect the A-channel image. These seven images are used to obtain the processed or precision FRET (PFRET) image.
Sample Images
Image
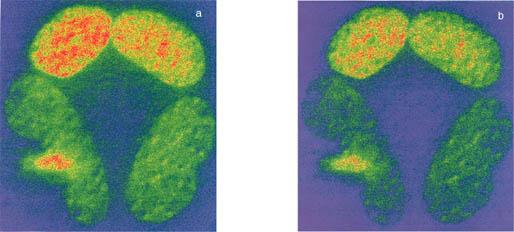
Figure 1: DVFRET bleed-through corrected images for BFP-GFP-Pit-1 protein.
As is described in the text, the donor (D) and the acceptor (A) images were acquired and then processed for bleed-through correction using PFRET software. The correction removed about 30% of the contaminated signal as noticed in the right side of the figure (b).
Image
Statue of Thomas Jefferson
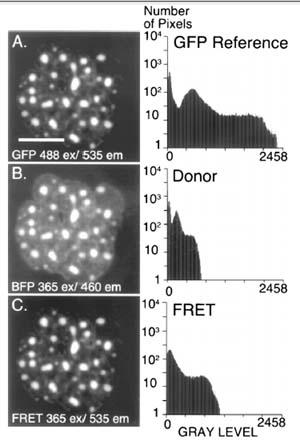
Figure 2: FRET Microscopy with BFP-GFP- C/EBPD244 [Methods 25: 4–18, 2001]
Pituitary GHFT1-5 cells were co-transfected with expression vectors encoding GFP– and BFP–C/EBPD244. (A) A reference image showing the nucleus of a cell coexpressing these two proteins was acquired using the GFP filter set to establish the expression level for GFP–C/EBPD244 (bar 5 10 mm). (B) A second digital image was obtained at the same focal plane using the donor filter set to detect the BFP–C/EBPD244 signal. (C) By changing only the emission filter and using identical conditions as for (B), the acceptor (FRET) image was then acquired. The histograms shown demonstrate that the signal in the FRET channel exceeds the donor signal, and is greater than the signal expected for spectral cross talk alone.
Image
Diplomacy Lab in the Dome Room of the Rotunda
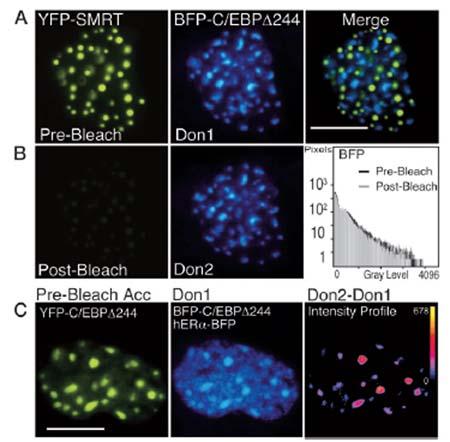
Figure 3: Acceptor Photobleaching FRET [Mol. Endocrinol, 17(3): 333–345, 2003].
Fluorescence images were acquired using an inverted IX-70 equipped with a _60 aqueous-immersion objective lens (Olympus Corp., Lake Success, NY). The filter combinations were 500/15-nm excitation, 525-nm dichroic mirror, and 545/25-nm emission for YFP, and 365/15-nm excitation, 390-nm dichroic mirror, and 460/50-nm emission for BFP (Chroma Technology Corp., Brattelboro, VT).
A, Pituitary GHFT1–5 cells were co-transfected with plasmids encoding the corepressor protein SMRT, tagged with YFP, and the C/EBP_244 deletion mutant fused to BFP. Sequential images of the nucleus of a cell co-expressing the proteins were acquired at the same focal plane using appropriate filters. The calibration bar indicates 10 microns.
B, The YFP-SMRT was photobleached by 5 min of exposure to 500-nm light. Post-bleach images were acquired at the same focal plane and under identical conditions todocument the bleaching of YFP and to show that this had no effect on the BFP signal (histogram).
C, Acceptor photobleaching FRET measurements detect only specific protein associations. Pituitary GHFT1–5 cells were cotransfected with plasmids encoding both YFP- and BFP-C/EBP_244, and hER_-BFP, and cells were identified that expressed all three labeled proteins. The prebleach images of the acceptor, YFP-C/EBP_244 (left panel), and the combined fluorescence from the donor, BFP-C/EBP _244 (foci) and the nucleoplasmic-localized hER_-BFP (Don1) are shown. The YFP fluorophore was bleached by greater than 90%, and a second donor image (Don2) was acquired at the same focal plane and under identical conditions as the first. The pixel-by-pixel change in gray-level intensity of the donor signal was obtained by digital subtraction of the Don1 image from the Don2 image.
The intensity profile (right panel) represents the change in the gray-level intensities in the dequenched donor image (Don2 - Don1). The calibration bar shows the range of gray-level intensities in the dequenched image with black indicating 0 and yellow indicating the maximum gray-level value (shown next to the calibration bar). Note that the increase in donor intensity was limited to the foci.