General Information
The two- or three-photon (or multiphoton) excitation laser scanning microscope (nonlinear microscope) works by using two or three red-wavelength photons to obtain both sensitivity and depth resolution without a confocal aperture. The multiphoton technique considerably reduces autofluorescence and photodamage above and below the focal plane, and the volume of the focal plane depends on a diffraction spot created by the objective lens.
Two-photon absorption was theoretically predicted by Goppert-Mayer in 1931, and it was experimentally observed for the first time in 1961 by using a ruby laser as the light source (Kaiser and Garrett, 1961). The original idea of two-photon fluorescence scanning microscopy was proposed by Sheppard et al. (1977) and was experimentally demonstrated for biological imaging by Winfried Denk and Watt Web (Science 1990).
Physics of Two-Photon Excitation
The probability of two-photon absorption depends on the co-localization of two photons within the absorption cross section of the fluorophore, and the rate of excitation is proportional to the square of the instantaneous intensity. Two-photon excitation is made possible by the very high local instantaneous intensity that is provided by a combination of diffraction-limited focusing of a single laser beam in the specimen plane and the temporal concentration of a femtosecond (fsec) mode-locked laser. The two-photon advantage is roughly proportional to the inverse excitation duty cycle, for example, a 100,000-fold improvement over CW illumination is achieved by using 100-fsec pulses at 80 MHz repetition rate. The use of such short pulses and small duty cycles is, in fact, essential for image acquisition in a reasonable time while using "biologically tolerable" power levels.
Advantages of Multiphoton Excitation Microscopy (MEM)
- In one-photon excitation LSCM, photobleaching occurs well above and below the focal (volume) plane; in MEM, the photobleaching is considerably reduced, and illumination of laser light occurs only at the focal plane, diffraction limited spot.
- Repeated scanning on the specimen in LSCM, particularly with UV light, induces rapid photoisomerization and high background autofluorescence. MEM reduces these complications, providing better penetration at infrared wavelengths and thus prolonging cell viability during image acquisition.
- The LSCM technique requires special UV optics for the UV excitation probe. MEM uses conventional microscope optics.
- In LSCM, the emission wavelength is close to the excitation wavelength (about 50-200nm). In MEM, the fluorescence emission occurs at a wavelength substantially shorter than the excitation wavelength.
How to collect FRET Images
In Multiphoton FRET (MP-FRET) imaging, we select the appropriate filters and high sensitivity photomultiplier tubes (PMTs) to acquire donor and acceptor images. It is important to note that appropriate average power should be used to reduce photobleaching.
If the donor and acceptor excitation wavelength are not known, the procedure one would follow to identify the excitation wavelength for the selected FRET pair is as follows: For MP-FRET, the ti:sapphire laser is tuned to detect the maximum and minimum signal for the donor and acceptor proteins expressed individually. The wavelength corresponding to maximum donor signal and minimum acceptor signal will be used to collect the FRET signal from the doubly expressed cells. For example, in the case of cells expressing C/EBPα protein tagged with Cerulean (donor) and Venus (acceptor), the laser wavelength is tuned from 700-1000 nm. The maximum Cerulean signal and minimum Venus signal are seen at 820 nm. Maximum Venus signal and minimum Cerulean signal are seen at 920 nm. Hence, an excitation wavelength of 820 nm is used to acquire the FRET images from doubly expressed (Cerulean-Venus-C/EBPα) cells. This method of selecting donor and acceptor excitation wavelengths can be used for any possible MP-FRET fluorophore pairs. Since the selected donor excitation wavelength can also excite (about <10%) the acceptor fluorophore molecule present, the technique requires correction to remove unwanted fluorescence signal in the FRET image (Elangovan et al., 2003; Periasamy and Day, 2005 - Chapter 7).
The background subtraction of the image is important to remove the autofluorescence, detector and optical noise. The SBT correction should be implemented as discussed in the data processing section. Seven images are required. In brief, (1) single labeled donor cells should be excited with donor molecule excitation wavelength and D- and A- channel images are acquired. (2) Single labeled acceptor molecule should be excited with donor and acceptor wavelength and the A- channel images are acquired. (3) Double labeled (D+A) cell should be excited with donor excitation wavelength and the D- and A- channel images are acquired. Acceptor excitation wavelength will be used to excite the D+A labeled cells and collect the A-channel image. These seven images are used to process to obtain the processed or precision FRET (PFRET) image.
The laser power for excitation for the donor and the acceptor may be different. But once you adjust the donor laser power (say 10%) and that should be used whenever you use the donor excitation wavelength. The same way the acceptor excitation wavelength, if you use, say 5% or 10% for the acceptor excitation wavelength then, the same acceptor power (5% or 10%) should be used whenever you use the acceptor excitation wavelength.
The gain of the PMT should be the same for both donor and acceptor emission channels. It is important not to saturate the pixel intensity.
Filter configurations for multiphoton image acquisition for selected fluorophore pairs
| Fluorophore | Excitation (nm) | Emission (nm) |
| Alexa 488 or Rhodamine | 790 | 515/30 or 590/40 |
| Cy3 | 735 | 590/70 |
| BFP | 740 | 450/80 |
| eGFP | 880 | 515/30 |
| CFP or Cerulean | 820 | 485/30 |
| YFP or Venus | 920 | 528/50 |
| Teal (mTFP) | 820 | 485/30 |
| dsRED1 | 780 | 590/70 |
| mOrange | 740 | 590/70 |
| S65T (GFP) | 770 | 515/30 |
Sample Images
|
Image
 |
Image
 |
Image
 South Lawn and New Cabell Hall
|
 |
 |
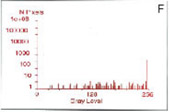 |
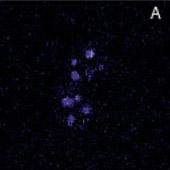
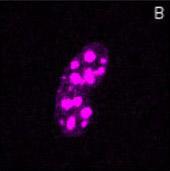
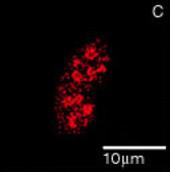
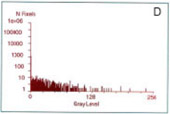
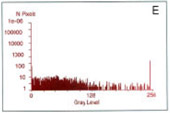
Localization of BFP- and RFP-C/EBP protein expressed in mouse 3T3 cells using 2p-FRET microscopy
The doubly expressed cells (BFP-RFP-C/EBP) were excited by 740 nm and the donor (A) and acceptor (B) images of proteins localized in the nucleus of a single living cell were acquired by single scan (slow scan). As explained in the text, the bleed-through (or cross talk) correction was implemented and then ratioed to obtain a FRET image is shown in C. The respective histograms are shown below the images (D, E, F). The higher gray level intensity distribution in Figure C compared to E indicates the importance of bleed-through correction and ratioing of the corrected D and A (A/D) images to localize the proteins. (Donor-blue color, Uncorrected FRET-pink color, and Corrected FRET-red color dots) Adapted from A. Periasamy, Microscopy and Microanalysis, In Press, 2001.