Image
What is SBT?
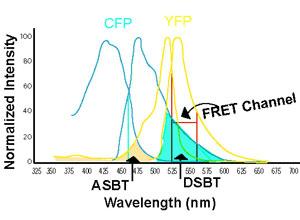
One of the important conditions for FRET to occur is the overlap of the emission spectrum of the donor with the absorption spectrum of the acceptor. As a result of spectral overlap, the FRET signal is always contaminated by donor emission into the acceptor channel (DSBT) and by the excitation of acceptor molecules by the donor excitation wavelength (ASBT) (see Figure). Both of these signals are termed spectral bleed-through (SBT) signal into the acceptor channel. In principle, the SBT signal is same for both 1p- and 2p-FRET microscopy. In addition to SBT, the FRET signals in the acceptor channel also require correction for spectral sensitivity variations in donor and acceptor channels, autofluorescence, and detector and optical noise, which contaminate the FRET signal.
Algorithm
The details of the algorithm to remove SBT and the relevant biological applications have been listed in the literature (Elangovan et al. 2003; Mills et al., 2003; Wallrabe et al., 2003; Periasamy and Day, 2005 (Chapter 7) .
In brief, to remove the spectral bleed-through or cross-talk for 1p- or 2p-FRET, seven images are acquired. Our approach works on the assumption that the double-labeled cells and single-labeled donor and acceptor cells, imaged under the same conditions, exhibit the same SBT dynamics. The hurdle we had to overcome was the fact that we had three different cells (D, A, and D+A), where individual pixel locations cannot be compared. What could be compared, however, were pixels with matching fluorescence levels. Our algorithm follows fluorescence levels pixel-by-pixel to establish the level of SBT in the single-labeled cells, and then applies these values as a correction factor to the appropriate matching pixels of the double-labeled cell.
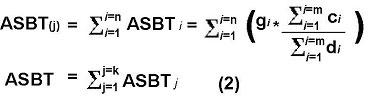
We use a,b,c,d,e,f,g to represent the seven images (See table below for clarification regarding the seven images). The following equations are used to remove the spectral bleed-through signal from the FRET channel image.
Image
Image
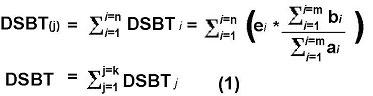
Where j is the jth range of intensity, m is the number of pixel in a and d, n is the number of pixel in e and g, DSBTi is the donor bleed-through of the pixel (i) in f, ai is the intensity of pixel i, so is bi, and ei, k is the number of range, DSBT is the total donor bleed-through, ASBTi is the acceptor bleed-through of the pixel (i) in f, ci is the intensity of pixel i, so is di, and gi.k is the number of range, ASBT is the total acceptor bleed-through.
The precision FRET (PFRET) is calculated using following equation where uFRET represents uncorrected FRET which is image f:
PFRET=uFRET-DSBT-ASBT
Energy transfer efficiency (E)
Conventionally, energy transfer efficiency (E) is calculated by ratioing the donor image in the presence (IDA) and absence (ID) of acceptor. When using the algorithm as described, we indirectly obtained the ID image by using the PFRET image (Elangovan et al., 2003). ID=IDA+PFRET where IDA is image e. The efficiency calculation is shown in following equation:
E=1-[IDA/(IDA+PFRET)]
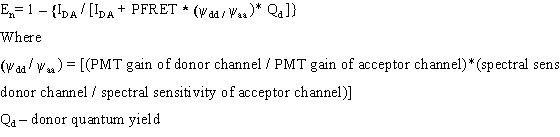
It is important to note that there are a number of other processes involved in the excited state during energy transfer. The new efficiency (En) is calculated by generating a new ID image by including the detector spectral sensitivity of donor and acceptor channel and the donor quantum yield with PFRET signal as shown in following equation
Image
Software
Based on the algorithm described above, our center developed a user friendly PFRET software package (ImageJ Plugins) to process the FRET data. Anyone require training on FRET and the PFRET software should attend our annual workshop on FRET microscopy during March. The PFRET software can be purchased at UVA patent Foundation (https://lvg.virginia.edu/).
Seven Images Required for FRET Data Process
|
Symbol |
Fluorophone or Sample |
Excitation Filter/Excitation Wavelength |
Emission Filter/Emission Wavelength |
Meaning |
|
a |
Donor Only |
Donor |
Donor |
Signal from a donor only specimen using donor excitation and donor emission filter set. |
|
b |
Donor Only |
Donor |
Acceptor |
Signal from a donor only specimen using donor excitation and acceptor emission filter set. |
|
c |
Acceptor Only |
Donor |
Acceptor |
Signal from an acceptor only specimen using donor excitation and acceptor emission filter set. |
|
d |
Acceptor Only |
Acceptor |
Acceptor |
Signal from an acceptor only specimen using acceptor excitation and acceptor emission filter set. |
|
e |
Donor and Acceptor |
Donor |
Donor |
Signal from donor-and-acceptor specimen using donor excitation and donor emission filter set. |
|
f |
Donor and Acceptor |
Donor |
Acceptor |
Signal from donor-and-acceptor specimen using donor excitation and acceptor emission filter set. |
|
g |
Donor and Acceptor |
Acceptor |
Acceptor |
Signal from donor-and-acceptor specimen using acceptor excitation and acceptor emission filter set. |