Confocal Theory
Confocal Microscopy is rapidly gaining acceptance as an important technology owing to its capability to produce images free of out-of-focus information. In a conventional epi-fluorescence microscope, the entire specimen or focal planes are exposed to excitation light and the emission collected by high NA objectives comes from throughout the specimen, whether above or below the focal plane. This seriously degrades the image by reducing the contrast and sharpness. In confocal microscopy out-of-focus information (blur) is removed in real time. In addition, confocal microscopy provides a significant improvement in lateral resolution and the capacity for direct, non-invasive serial optical sectioning of intact, thick living specimens.
Confocal Microscopy was introduced in 1957. Most confocal microscopes are of two types: (1) stage-scanning (SSCM), and (2) laser scanning (LSCM). The SSCM is assembled on an epi-illuminated microscope employing a stationary laser as an excitation source, a photomultiplier as the detector and a specimen holder (stage) which moves and thus allows the specimen to be "rapidly" scanned in the X-Y plane. A pin-hole in the emission path coupled with a high NA (1.4) objective lens removes out-of-focus information and sharply improves the contrast. However, SSCM requires a relatively long period of time (~10 sec) to acquire a single image. Thus the SSCM can be used satisfactorily for fixed specimens or microelectronic circuits, but not for the live specimens where dynamic events are occurring.
Laser Scanning Confocal Microscopy (LSCM)
Many investigators designed confocal microscopes for use with live specimens to image dynamic events in which a fixed microscope stage is scanned by a laser beam using a rotating disk or mirror galvanometers. LSCM generates a clear, thin image (512 X 512) free from out-of-focus information within 2 or 3 seconds. A single diffraction-limited spot of light is projected on the specimen using a high numerical aperture objective lens and the light reflected or fluoresced by the specimen is collected by the objective and focused upon a pinhole aperture and the signal detected by a photomultiplier. Light originating from above or below the image plane strikes the walls of the pinhole and is not transmitted to the detector. To generate a two-dimensional image (x, y), the laser beam is scanned across the specimen pixel-by-pixel. To produce an image using LSCM, the laser beam must be moved in a regular two-dimensional raster scan across the specimen and the instantaneous response of the photomultiplier must be displayed with equivalent spatial resolution and relative brightness at all points on the synchronously scanned phosphor screen of a CRT monitor.
For a three-dimensional projection of a specimen, one needs to collect a series of images at different Z-axis planes. The vertical spatial resolution is approximately 0.5um for a 40X 1.3 NA objective. Three-dimensional image reconstruction can be accomplished with many commercially available software systems.
The photomultiplier tube (PMT) used in LSCM has highly desirable characteristics compared to video cameras: (1) stability; (2) low noise; (3) very large dynamic range (> 1 million fold); (4) sensitivity; (5) wide range of spectral response; (6) rapid response; and (7) small physical size. The PMT has a low quantum efficiency (QE) compared to camera of about 40% at 546nm . The alternative, a cooled-PIN photodiode, has a QE of 60-80% but an equivalent noise level of about 100 photons/pixel so that it is not useful for weak signals. The optimum selection of pinhole size is important in the compromise between intensity (brightness) and thickness of the slice observed. For instruments with variable pinholes, an optimum pinhole diameter should be determined empirically to provide the best combination of brightness and slice thickness.
Laser scanning confocal FRET (C-FRET) microscopy overcomes the limitation of out-of focus information owing to its capability of rejecting signals from outside the focal plane and acquiring the signal in real-time (Wallrabe et al, 2003). This capability provides a significant improvement in lateral resolution and allows the use of serial optical sectioning of the living specimen. By selecting appropriate filter combinations and excitation wavelength, one can configure any commercially available confocal microscopy system for FRET imaging.
Disadvantages of LSCM
A disadvantage of this technique is that the wavelengths available for excitation of different fluorophore pairs is limited to standard lasers lines. Standard laser lines do allow C-FRET to be used for a number of fluorophore combinations including Cerulean-Venus or ds-RED, GFP-Rhodamine or Cy3, FITC or Alexa488-Cy3, Alexa488-Alexa555 and Cy3-Cy5 (Day et al., 2003; Elangovan et al., 2003; Kenworthy et al, 2000; Mills et al, 2003; Periasamy, 2001; Wallrabe et al, 2003). In general, the laser lines available in the current LSCM can be used for most of the FRET pairs. Currently, the confocal vendors may provide the LSCM system with any laser lines if it is requested in advance before purchasing the LSCM.
Also, in one-photon wide-field or confocal microscopy, illumination occurs throughout the excitation beam path, in an hourglass-shaped pattern. This results in absorption along the excitation beam path, giving rise to substantial fluorescence emission both below and above the focal plane. Excitation of other focal planes contributes to photobleaching and photodamage in the specimen planes that are not being involved in imaging. This can be ameliorated by Multi-photon/2-photon microscopy.
How to collect FRET Images
In Confocal FRET imaging, we select the appropriate filters, D & A excitation wavelengths, and high sensitivity photomultiplier tubes (PMTs) to acquire donor and acceptor images. It is important to note that appropriate average power should be used to reduce photobleaching.
The background subtraction of the image is important to remove the autofluorescence, detector and optical noise. The SBT correction should be implemented as discussed in the data processing section. Seven images are required. In brief, (1) single labeled donor cells should be excited with donor molecule excitation wavelength and D- and A- channel images are acquired. (2) Single labeled acceptor molecule should be excited with donor and acceptor wavelength and the A- channel images are acquired. (3) Double labeled (D+A) cell should be excited with donor excitation wavelength and the D- and A- channel images are acquired. Acceptor excitation wavelength will be used to excite the D+A labeled cells and collect the A-channel image. These seven images are used to process to obtain the processed or precision FRET (PFRET) image.
The laser power for excitation for donor and the acceptor may be different. But once you adjust the donor laser power (say 10%) and that should be used whenever you use the donor excitation wavelength. The same way the acceptor excitation wavelength, if you use, say 5% or 10% for the acceptor excitation wavelength then, the same acceptor power (5% or 10%) should be used whenever you use the acceptor excitation wavelength.
The gain of the PMT should be same for both donor and acceptor emission channels. It is important not to saturate the pixel intensity.
Filter configurations for confocal image acquisition for selected fluorophore pairs.
| Fluorophore | Excitation wavelengh (nm) | Emission filter (nm) |
| Alexa 488 or GFP | 488 | 515/30 or 535/50 |
| Cy3 or Rhod-2 | 543 or 561 | 590/70 |
| CFP | 457 | 485/30 |
| dsRED1 | 543 | 590/70 |
| Cerulean or Teal (mTFP) | 457 | 485/30 |
| YFP | 514 | 500-550 |
| Venus | 514 | 500-550 |
| Cy5 | 633 or 594 | 660LP |
Sample Images

Image
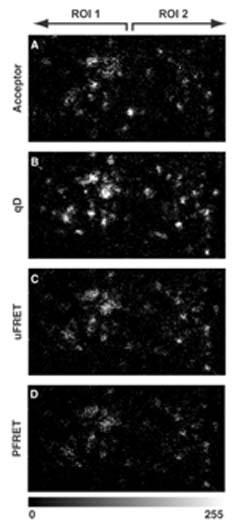
Figure 1. Confocal FRET Microscopy- Alexa488-Cy3-FRET in MDCK polarized cell [Biophy. J. 85(1): 559–571, 2003] Confocal FRET Image acquisition-MDCK polarized cells Imaging acceptor, qD, uFRET, and PFRET distributions of pIgA-R-ligand complexes in apical endocytic membranes. Double-labeled MDCK polarized cells, containing apically internalized Alexa488-pIgA-Rligand complexes (donor) and basolaterally internalized Cy3-pIgA-R-ligand complexes (acceptor), were imaged by confocal microscopy at an x-y (z-section) focal plane ;3.5 mm below the apical PM under the same imaging conditions. These images were modified in Adobe Photoshop at the same rate to a higher level of contrast for better visualization. Images shown (overall size, 16.2 mm 3 8.7 mm) contain two ROIs of similar size (7.48 mm 3 7.48 mm), each one containing a complete cell. (A) Acceptor excitation/acceptor channel shows acceptor fluorescence intensities. (B) Donor excitation/donor channel shows the qD fluorescence intensities. (C) Donor excitation/acceptor channel represents uFRET, which includes energy transfer levels plus the two contaminants in the FRET signal: donor crosstalk and acceptor bleed-through. (D) PFRET image. Image C was processed by our custom correction algorithm, which removes donor cross-talk and acceptor bleed-through. The resulting image represents the actual energy transfer levels.
Image
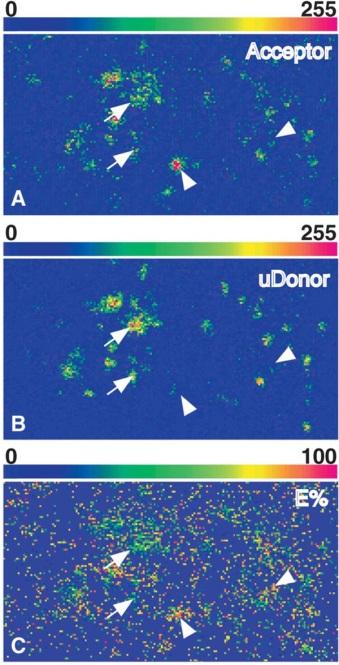
Figure 2. Pixel-by-pixel distribution of acceptor, uD, and E% values in apical endocytic membranes. [Biophy. J. 85(1): 559–571, 2003]
The two ROIs indicated in Fig. 2 were falsecolor-processed to show pixel-by-pixel distribution of acceptor (A), uD (B), and E% (C) values. The image contains 184 3 99 pixels (pixel size, 88 3 88 nm) and each ROI contains 85 3 85 pixels. Higher levels of uD correlate with lower E% levels and vice-versa. Arrows show pixels with high uD/low E%, whereas arrowheads indicate low uD/high E%.
Image
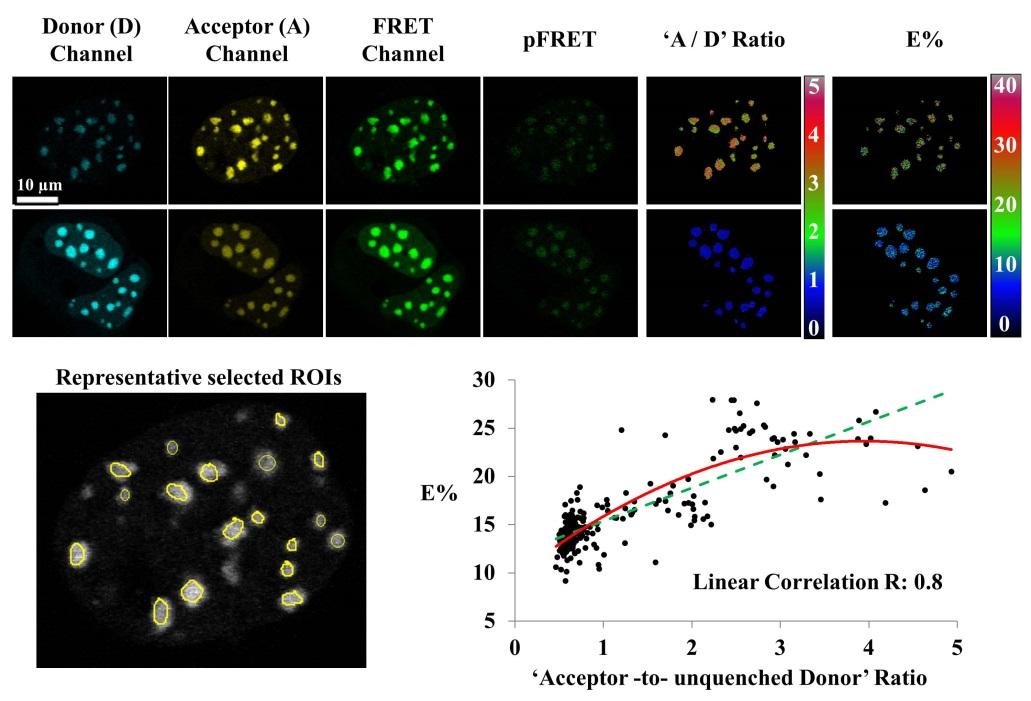
Figure 3. Confocal FRET microscopy using the PFRET method. [Cytometry Part A, 83A: 780-793, 2013]Images of live cells co expressing Cerulean- (donor) and Venus- (acceptor) tagged bZip were acquired in the Donor, FRET, and Acceptor imaging channels. Together with the images acquired from cells only expressing bZip-Cerulean or bZip-Venus (not shown), the images of the double-expressing cells were processed using the PFRET algorithm to remove SBT contaminations and calculate the pFRET and the FRET efficiency (E%) images (see text and Table 2). Due to different acceptor:donor (“A/D”) ratios, a range of E%s emerged. As an example, two sets of images of doubleexpressing cells having different “A/D” ratios are shown for a comparison: for each set, the raw and pFRET images are contrasted in the same range (top: 0–1500, bottom: 0–3000, 12-bit); the “A/D” ratio image was obtained by calculating pixel-by-pixel ratios between the two images acquired in the acceptor and the donor imaging channels, respectively; the ratio (0–4) or E% (0–40) images of both sets are color contrasted in the same range, indicating larger “A/D” ratios yielding higher E%s. This is confirmed by plotting E% against the “acceptor to unquenched donor” ratios for 230 regions of interest (ROIs) selected from 15 cells. The unquenched donor is determined by adding the PFRET signal (multiplied by the coefficient “c,” see text) to the quenched donor signal. The graph shows an increasing trend of E% with an increased “acceptor-to-unquenched donor” ratio, by either a second-order polynomial (solid) or linear (dashed) curve fitting. (Zeiss 510 Meta confocal microscope and 63X1.4NA oil immersion objective; the Donor channel: the 458 nm laser line and the 470–500 nm band-pass filter; the FRET channel: the 458 nm laser line and the 535–590 nm band-pass filter; the Acceptor channel: the 514 nm laser line and the 535–590 nm band-pass filter).